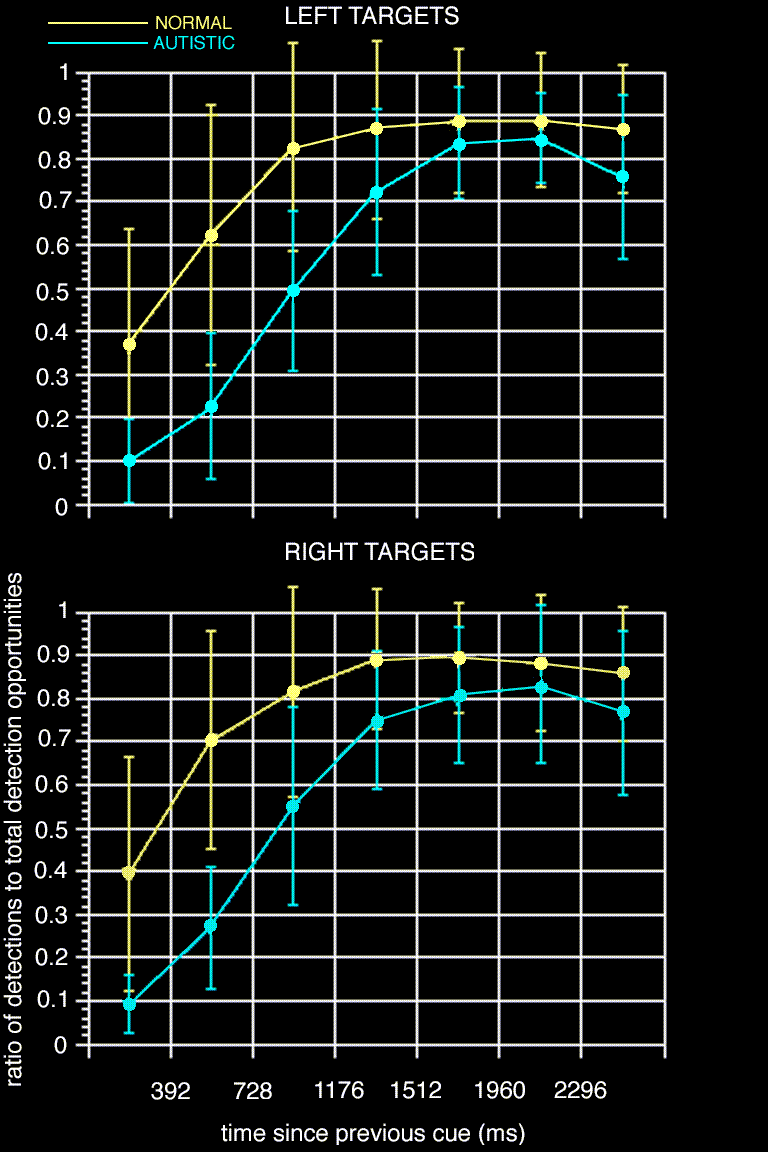
 Before I show you what we found in the EEG, here are the behavioural data. The horizontal axis is the number of milliseconds since the last cue to shift attention, and the vertical axis is the fraction of targets detected.
The yellow is the normal data, and the blue is autism.
As you can see, even for people without autism this task becomes very difficult when targets come very close together in time.
However, for people with autism, accuracy decreases much more steeply as the interval between shifts of attention goes below about two seconds.
`Physiological Studies of Attention in Autism: Implications for Autistic Cognition and Behaviour', Matthew Belmonte, 26 January 2002